The histogram is one of the Photographer most important tools, and is under used by many Photographers. All DSLR and most digital point and shoot cameras have the ability to display both the image and Histogram on the camera’s LCD screen.
After each shot, I will examine the histogram to discover whether the image contains a good range of tonal values. The brightness levels for every pixel in the image are recorded, for a 8 bit this level can range from 0 to 255. (0 is absolute black and 255 is absolute white) The horizontal axis of the histogram represents the brightness level and thus has values of 0 to 255. The vertical axis of the histogram represents the number of pixels that have one particular value.
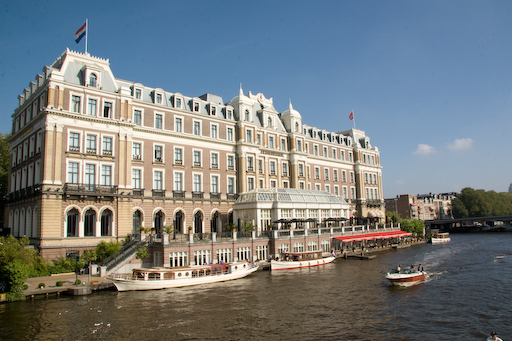
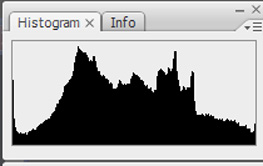
The image and it’s histogram below displays a good range of tones. You can see that the majority of the pixels are close to the center of the histogram.
A light meter, records for mid tones which has a numeric value of 128, the reading will be an average of all the areas of the image that camera considers important. (How theses areas are determined are dependent on the meter setting that you have selected, i.e. spot, center weighed etc). If there are more dark or light areas in the image the camera may under or over expose these areas respectively. This means that a dark image will have many pixels with brightness levels that are close to 0 and that a light image will have many pixels with brightness levels that are close to 255. The edges (about 5 pixels) should not be taken into consideration when you are analyzing the image. As these are at the edge of the sensor dynamic range. The distribution of the pixels is a complex subject which has been simplified for clarity.
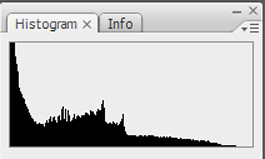
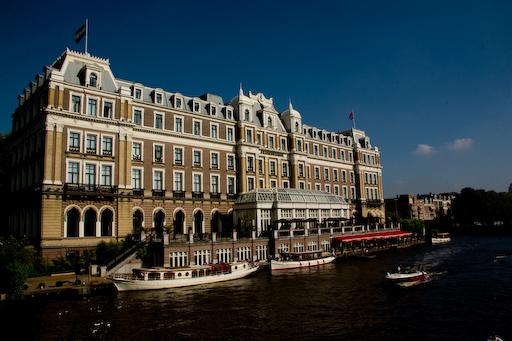
Determining whether the image has a good range of brightness levels, is where the Histogram comes in. It is a simple graph where you can see brightness levels from the darkest to the lightest. You can clearly see from the histogram whether the majority of pixels are too far to left or to the right. The image above and its histogram illustrates that there are large areas that are too dark.
As you can see from the image that is associated with this histogram that contains large dark areas. The sky is very dark, so is the water, there is no detail in the shadows. When you viewed this image on the LCD of the camera, you can determine whether you need to adjust the exposure and re-shoot if necessary. Viewing the image on the LCD alone will not give you this information, which is why you always need to view the histogram.
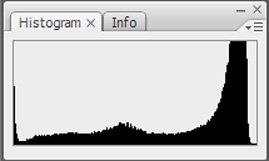
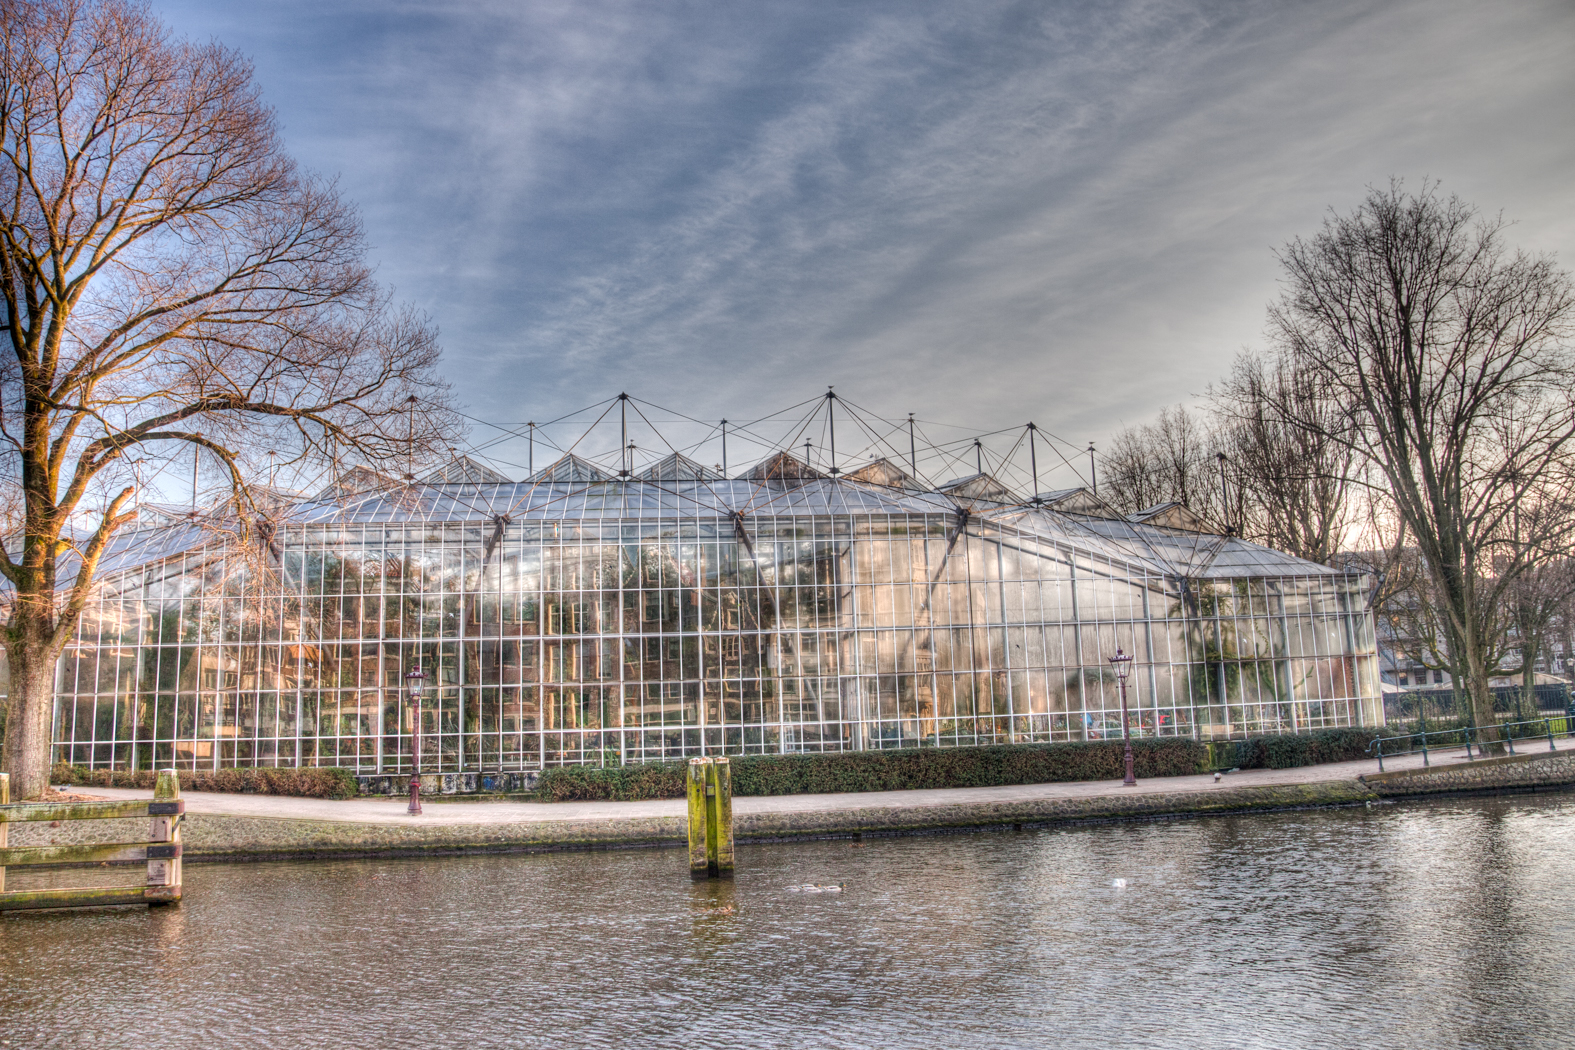
When the graph is too far to the right, then the image will have too many bright areas, as shown in the image below.
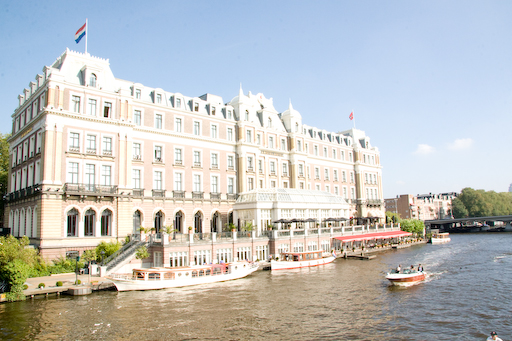
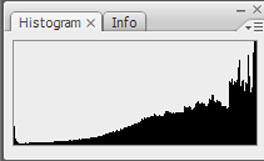
When there a lot of pixels on the right, then the highlights are blown out and the image may be overexposed. When there are a lot of pixels to the left, there are loss of detail in the shadow and the image may be underexposed. Note that I say may be, this determination depends on what your are photographing (More on this latter).
So what can you do to correct an image that is either under or over exposed.
The histogram is only a guide to help you take better pictures, there is no such thing as a correct histogram. It is only a indication that an image is either under or over exposed. As an image that contains large number of dark or light pixel might be just what you wanted.
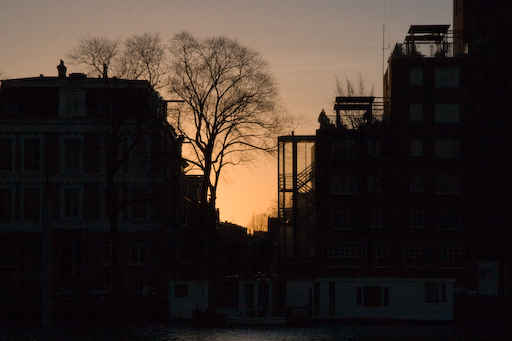
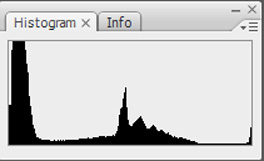
Examples of this are silhouettes which will contain large areas of dark pixels, or images of snow which will contain a lot bright pixels.
The picture of the silhouette and it’s histogram below shows a lot there are a lot of dark pixels and thus for type of image that I was trying to produce is correctly exposed.
The picture of the snowman and it’s histogram below shows a lot there are a lot of bright pixels and thus for type of image that I was trying to produce is correctly exposed.